Tool -
B3.06
Tool -
Institutional mapping is a visual method of identifying key institutions, illustrating their relationships, and specifying the respective function they play within a specific sector or area of governance. Institutional mapping provides an overview of the power structure and its influence given a specific issue, geographic and legal boundaries of governance, how governance relates to human activities, and insight into the social hierarchy. Institutional maps typically illustrate the following key structural features:
Institutions: these are the formal and informal stakeholder groups and organisations that play a role within a specific area of governance (e.g., ministries and governmental offices, civil society organisations, private actors, etc.)
Roles and Functions: several different functions are performed under a specific area of governance. Such function can include for instance informing, consulting, authorizing, financing, operating, regulation, etc. An institutional map must specify what are the roles played by each institution that is depicted within the institutional map.
Relations: institutional maps are not only about understanding “who does what”, it is also about identifying “how institutions relate to each other”. Whether an institution reports to another is a critical feature that needs to be depicted in an institutional map. You can also use an institutional map to characterise whether institutions have a positive or adverse relationship and how strong that relationship is.
Boundaries: in certain sectors decisions are made at various levels (municipal, watershed, regional, national, regional, etc.). Maps should illustrate where actors situate themselves across those geographic boundaries of governance.
Figure 1 below provides an example of an institutional map highlighting these main structural elements.

Figure 1. Institutional Map of Water Resources Management in Cape Town, South Africa (Source: OECD, 2021)
Institutional mapping is similar to stakeholder mapping or analysis (Tool C1.03), in that it also allows for stakeholder identification. However, the institutional mapping holds for a specific advantage as it does not only identify the different stakeholders but equally Illuminates interlinkages and strengths of relationships between the different stakeholders. Stakeholder identification is the first and most vital step in every project implementation at any level. Carrying out an institutional mapping in the water sector is important for every water organisation as well as the government of countries. Some of the advantages, underlining the importance of carrying out an institutional mapping, include:
Aids in identifying and assessing the various project stakeholders: Institutional mapping is more than just demonstrating the relationships between stakeholders and the current project or organisation, it also shows the interrelations as well as the strengths of these relationships. The exercise makes it easy to identify relevant stakeholders, prioritize them and identify relations that may provide opportunities (Bourne & Weaver, 2009)
Failing to identify the most important individuals or organisations to your water project can have a negative impact on your project: as many valuable resources will be allocated in the wrong places, potentially increasing project costs, and creating unnecessary delays. In more severe circumstances, it might cause work stoppages and even harm your organisation’s or company's image. Institutional mapping delivers insights that will assist you in identifying strategic stakeholders in order to develop more complex engagement strategies (Crabbé & Robin, 2006).
Institutional mapping promotes effective dialogue/information sharing: between communities, local action planners, heads of governments, water agencies, and heads of basin organisations to construct shared vision (Tool C2.02) and understand their contributions and its subsequent impacts to that particular project. It provides an opportunity to holistically engage all stakeholders that are related to a project directly or indirectly.
Institutional mapping makes it possible to understand the interconnections, bottlenecks, alliances, institutional overlaps, etc. in the water sector. Institutional mapping can also be applied at different levels, which is useful as water policy and governance is multi-layered. Two main reasons why institutional mapping is ideal for the water sector are 1) that it helps us understand the different actors/sectors in the water sector, and 2) that it allows us to capture the different levels of water governance, from household to country levels.
Institutional mapping has been applied to different sectors of the water sector globally. For example, Wallis & Ison (2011) used institutional mapping used institutionall mapping exercises with practitioners in water management to illustrate the value of 'relational capacity' among water managers when navigating institutional complexity caused by merging integrating, or centralising institutions in Australia (Wallis & Ison, 2011). In Finland, institutional mapping has been applied to understand the relationship between various drivers of water-related risks and vulnerabilities. (Räsänen et al., 2017). Similarly, Crabbé & Robin (2006) applied institutional mapping to understanding the various institutional barriers and bridges to local climate change impacts adaptation affecting small rural municipalities and Conservation Authorities in Canada (Crabbé & Robin, 2006). A study in the United Kingdom (Cleaver, 1998) aimed at understanding how incentives and informal institutions influence and include gender in the water management sector. Institutional mapping has equally been used to understand the perceptions of decision-makers within, and the response of diverse national, regional, and international institutions to conflicts that arose as a result of the complex challenges of climate change in the Central African Republic (Brown et al., 2013).
Here are some steps needed towards developing an institutional map:
Step 1 – Define your domain: The first step with developing an institutional map is to define the specific sector or area of governance that the map will pertain to. There are many sub-sectors to choose from in relations to water resources management, for instance, WASH, irrigation, pollution, disaster management, etc. Moreover, you can choose to further detail your institutional map by choosing a specific area within that sphere, for example, decide to focus on WASH financing or WASH and gender inclusion.
Step 2 – Identify institutions: Once you have identified your area of governance, the next step is to identify “who matters?”. You can do that by simply listing all institutions/group of actors that relate to your selected sector or domain of governance.
Step 3 – Specify institutional functions: The next step is to understand “who does what?”: Then write down what are the key roles and functions performed by each of those actors (e.g., informing, regulating, implementing, supervising, financing, consulting, etc.). Here are some questions that can help you uncover the roles played by each institution: Who has the authority to give authorisations? Who can use resources? Who can inspect? Who owns what? Who operates infrastructures? Who pays for it? (McFadden et al., 2010).
Step 4 – Describe the relationships: think about how institutions relate to each other, e.g., if one institution reports to the other, if it is a direct or indirect relationship, whether it is good or bad relationship and the strength of the relationship (from very weak to very strong).
Step 5 – Group institutions into clusters: you can group specific organisations depending on the politico-administrative or geographic level they belong to (local, regional, national, international, etc.). You can also group institutions based on their shared role and functions (operators, regulators, financiers, etc.). Refer back to Figure 1 for example of geographic and functional clustering.
Institutional Perception Mapping (IPM) is a type of institutional mapping that can be applied to understand the relationship between what is identified as the “prime” (most central actor) and other institutional entities which also operate and influence that sphere of governance (Figure 2). Since IPM is about the perception of the stakeholders participating in the mapping, it is best if the exercise can include a diverse group of individuals representing key institutions relevant to that sector.
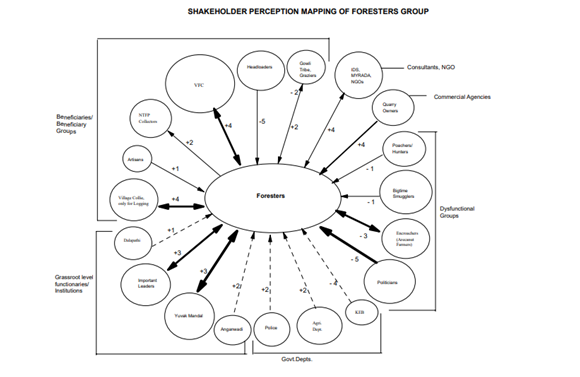
Figure 2. An example of an IPM (Source: World Bank, 2014)
Here are some steps that are recommended in developing a participatory IPM (World Bank, 2014):
Step 1: Selecting Participants
Selecting the participants is a crucial as it will determine the quality of the IPM that will be produced at the end. In choosing your participating institutional representative you can consider few criteria for diversity: area of expertise, gender, age, ethnicity, level of influence.
Step 2: Provide Introductions and Explanations
The facilitator should introduce the purpose of the exercise as well as define the domain and scale selected for producing the IPM. The facilitator and observer/notetaker should begin working with each group by introducing themselves and outlining the discussion's goals and objectives. Clear instructions should be provided as to how this exercise is to be carried out and what is expected from the participating stakeholders. Equally ensure that the participants are comfortable with the topics to be covered.
Step 3: Produce an Institutional Perception Map
To produce an IPM the group of participants will need to proceed with the following tasks:
Identify the key institution/stakeholder groups: The “prime” institution/stakeholder is always placed at the centre of the IPM. Identifying the main stakeholder will depend on your objective or what you would like to gather information about.
Identify all other institutions/stakeholder groups: These stakeholders are those that are connected to the main stakeholder in one way or the other.
Group all institutions/stakeholder groups: Different stakeholders may be grouped according to sectors, institutions, politico-administrative levels etc.
Establish relationships: Relationships are the interlinkages between the different stakeholders and may vary. Relationships can be represented using lines; Broken lines (------) for a weak relationship; single line (—) for a medium relationship; a thick single line (—) for a strong relationship.
Establish the direction of the relationship: The stakeholder relationships may be positive (+) or negative (-). Positive relationships usually represent a good interlinkage and that they work well together, while negative relations may indicate that these organisations or stakeholders often find themselves in conflict with each other. Typically, the relationship is graded according to a 10 points scale (very negative (-5) to very positive (+5)).
Step 4: Discussing and Consolidating the Institutional Perception Maps
IPM exercises are typically carried out in segmented groups. To get better outcomes from the exercise, all individual maps are then merged into a consolidated IPM. Overlaps and discrepancies between the different IPMs should be discussed with the group so that everyone gets to say how they perceive the different views of the institutional structure. The consolidated map offers a basis for discussing what are the gaps, how certain relationships could be improved, where there are deadlocks and bottlenecks, and where its already working well, etc. As such, this consolidated map will be used to inform stakeholders and decision makers as it represents the general view of all stakeholders.
Institutional mapping can be difficult to conduct, and stakeholder participation might go wrong or have unintended outcomes (backfire). Institutional mapping can empower some and weaken others for different reasons. Below we have described a couple of challenges and circumstances worth considering before inviting stakeholders and during institutional mapping participatory exercises.
Time and money: An important practical challenge is that a comprehensive institutional mapping takes time and money. For example, a complexity analysis as suggested below may not be feasible in many situations. In resource-constrained projects, an institutional mapping can be done through a desk study rather than though a participatory IPM exercise. Doing a desk study however means that you will miss out on the possibility to engage your stakeholders and build their understanding of the social and institutional context (Rietbergen-McCracken & Narayan, 1998).
Ensuring inclusion and participation: When attributing relation strengths for example, some institutions with negative relation strengths may feel out of place or feel like not participating in the decision-making process. In such situations it is important that the coordinator or facilitator explains and clarifies any doubts that may cause stakeholder unhappiness. Paying attention to information access and participatory capability (time, finance, culture) for women, young, marginalized, and indigenous populations, ensures equity (Botes & van Rensburg, 2000). Paying attention to power-relations is of particular importance in the mapping process.
Institutional complexity: An important reason why institutional mapping is difficult, and that stakeholder involvement may backfire, is institutional complexity. Institutional complexity can be defined as the presence of “incompatible prescriptions from multiple institutional logics” (Greenwood et al., 2011: 317). Institutional logics may be defined as “socially constructed, historical patterns of cultural symbols and material practices that direct attention toward particular stimuli, specify criteria for legitimacy, and define what constitutes appropriate behavior” (Thornton et al., 2012:2). Compliance with the institutional logic thus endows an organisation with societal legitimacy.
The point of considering institutional complexity is that the number of competing logics and their degree of incompatibility are key elements that influence the speed, disruptiveness, and volatility of a structural transformation. This perspective directs our attention to the manifold institutional inconsistencies and contestations that may hamper transitions trajectories. Hacker and Binz (2021) provide an example from the water sector where they identify three guiding field logics:
‘Hydraulic’ logic: has historically aligned around large-scale, centralized, end-of-pipe infrastructures and operations based on state actors and the engineering profession.
‘Water-sensitive’ field logic: revolves around a decentralized infrastructure paradigm and diverging cultural ideas that draw more strongly on a community logic
‘Water market’ field logic: revolves around the market and corporation, with economic efficiency serving as core values (Hacker and Binz, 2021:372)
Considering this may enable stakeholders to discuss and develop new perspectives on how the organisations involved in a transformation process may best react to competing demands and navigate long periods of institutional contestation and insecurity and mitigate excessive complexity (Hacker and Binz, 2021). Strategies for coping with institutional complexity include:
Ensuring honest and transparent accounting for diverse institutional logics and discussing how they might influence different stages of project implementation
Ensuring coherence of vision, both within groups of stakeholders and between them (Bunduchi et. al, 2020)
Make sure to acknowledge, appreciate and care for ‘relational capital’ of managers built from long-term engagement in the water managing system (Wallis and Ison, 2011).